Ecological Model of Visualization
Capturing the influence of context

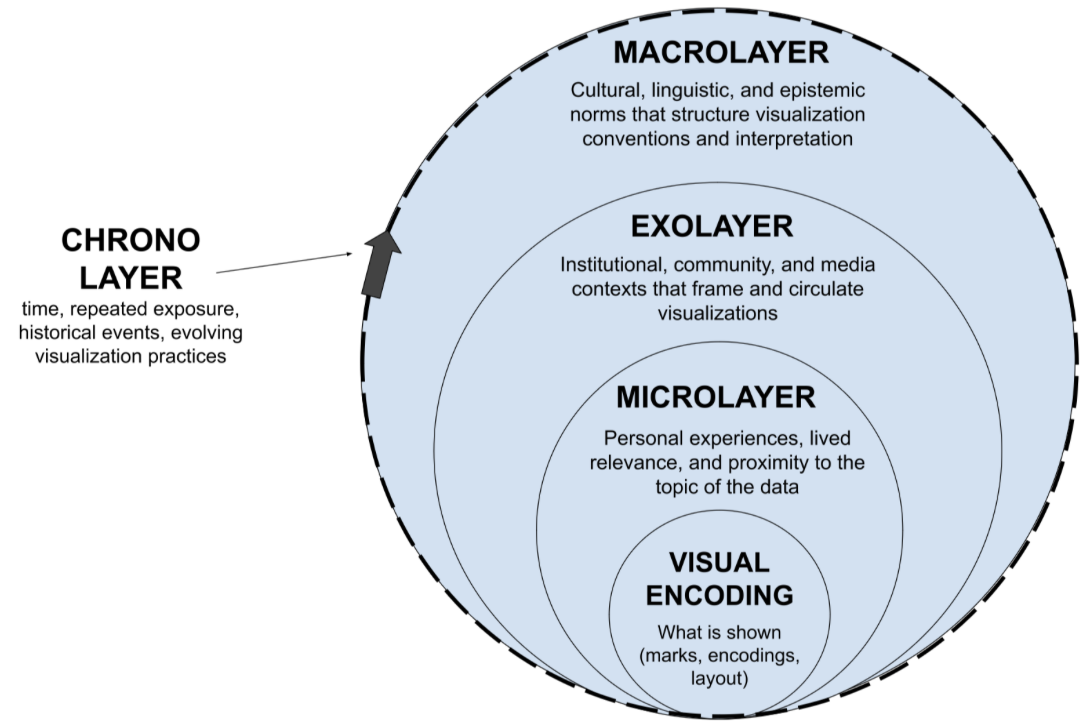
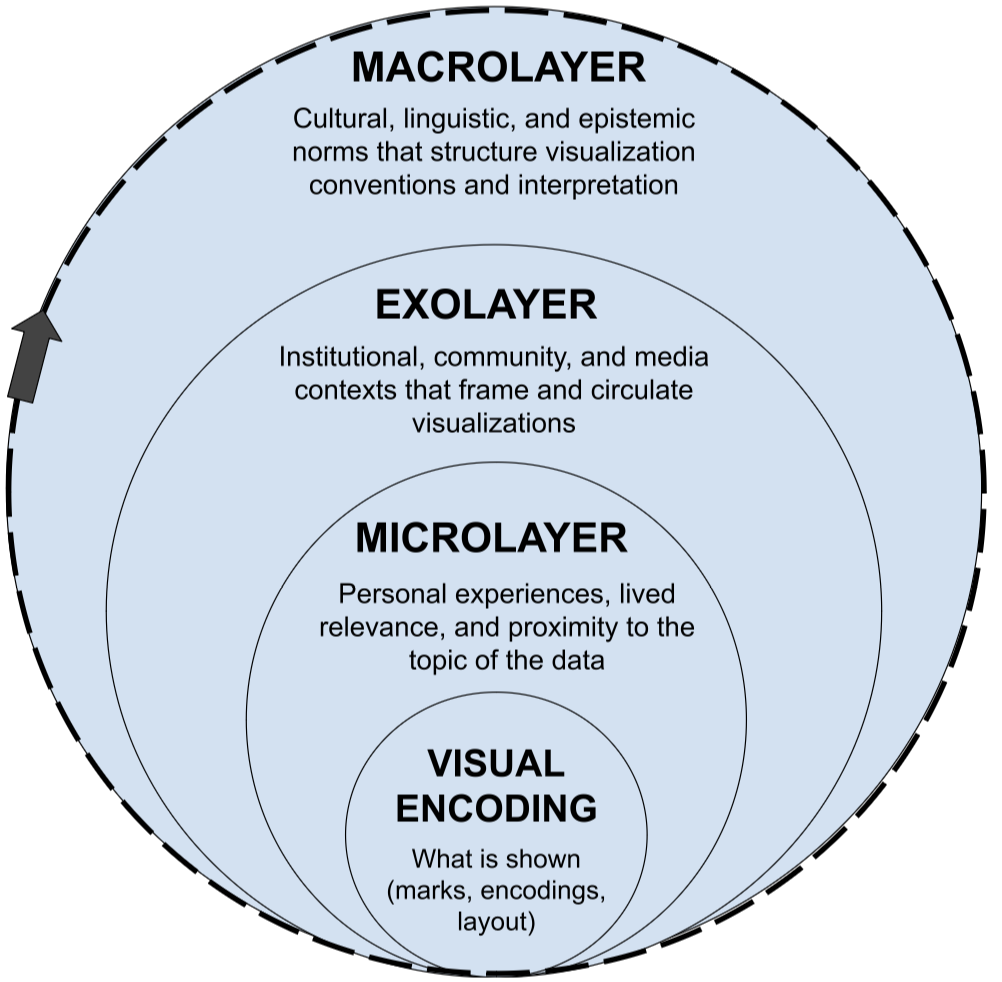
Visualization interpretation and trust does not just depend on the chart itself, but layers of context surrounding it - from personal experience to rhetorical framing to social context. We translate Bronfenbrenner’s Ecological Systems Theory (EST) to informaton visualization to create an organizing scaffold that both synthesizes prior visualization research and offers a systematic way to connect with adjacent disciplines, such as media studies and journalism.
- Core layer (Visual Encoding): What patterns, trends, or relationships can be read and understood from the visual encodings?
- Microsystem layer: Does this visualization feel relevant to me? How do my personal experiences, relationships, beliefs, and emotions shape how I engage with and interpret it?
- Exosystem layer: How is this visualization framed or contextualized? Who produced, circulated, or annotated it? What social, institutional, or media influences shape its presentation?
- Macrosystem layer: What cultural, linguistic, or epistemic assumptions does this visualization rely on? - Whose ways of knowing are prioritized or marginalized in how evidence is represented?
- Chronosystem layer (Temporal Layer): How do time, experience, and historical context shape interpretation? How might re- peated exposure, evolving conventions, or major events influence how this visualization is understood?
Publications
ACM CHI 2026 Workshop on Data Literacy, 2026
News
Apr 2026
Frida Mudsam’s workshop paper - From Charts to Context: An Ecological View of Visualization Literacy is presented at the ACM CHI 2026 Workshop on Data Literacy in Barcelona, Spain 🇪🇸. See our project page